Returns Index Survey Results – Rise in Costs Outpaces Volumes
By Cathy Roberson, Reverse Logistics Association
Results from the Reverse Logistics Association’s (RLA) second returns survey showed a continuation of rising returns volumes and costs for the fourth quarter of 2021 and expectations for a continuation of the same for the first quarter of 2022.
The rise in volumes and costs for the fourth quarter was attributed to the holiday season. According to the National Retail Federation (NRF), retail sales during 2021’s November-December holiday season grew 14.1% over 2020 to $886.7 billion. The number includes online and other non-store sales, up 11.3% at $218.9 billion.
The amount spent and the growth rate are new records, topping the previous records of $777.3 billion spent in 2020 and 8.2% growth that year.
Along with the record increase in holiday sales, the NRF noted that US consumers returned about $158 billion worth of goods purchased between November 1 and December 24, a 56% increase year over year and represented 17.8% of purchases versus 13.3% in 2020.
Fourth Quarter
Almost half of RLA survey respondents noted that returns volumes increased during the fourth quarter, while an equal percentage said that volumes either remained the same or did not increase. “Returns volumes were the same as fourth-quarter 2020,” commented one respondent.
Costs, however, increased for over 61% of the survey respondents, while 34% indicated that costs either stayed the same or did not increase.
Commentary included:
- Increased costs “driven by cost of freight.”
- “Labor increases and required surge pay needed for lack of labor.”
- “Labor and inflation pressures.”
Supply chain costs did indeed increase during the fourth quarter as shippers ordered early and paid dearly to ensure inventory was available in stores and online for the holiday season.
Some retailers such as Bed, Bath & Beyond, Abercrombie & Fitch, and ASOS noted that demand was greater than on-hand inventory during the holiday season. As a result, there were missed additional sales opportunities.
These missed opportunities and lean inventory practices by retailers could have attributed to the high percentage of survey responses that noted the same or no increase in returns volumes.
The returns index shows a decline in costs from the third quarter, likely due to seasonal decreases in some modes of transportation such as trucking, air, and ocean spot rates.
Volumes were up during the quarter due to higher retail sales during the holiday season.
| |
Q3 2021 |
Q4 2021 |
| Costs |
70.7 |
69.3 |
| Volumes |
49.4 |
49.9 |
Expectations
Over 61% of RLA survey respondents expect returns volumes to increase during the first quarter. Historically, January is a big month for holiday returns, thanks to lenient returns policies by retailers.
UPS expected to handle 60 million packages in returns during the November to January period, a 10% increase over 2020 holiday returns.
Survey comments ranged from expectations of similar volumes to the first quarter of 2021 to the growth of e-commerce driving up the number of returns.
Almost 70% of survey respondents expect returns costs to increase during the first quarter, with most citing the increase in freight costs and surcharges such as fuel. One survey respondent noted, “Our primary returns carrier has increased rates effective January 1, 2022, so we’ll pay a higher rate for returns.” Indeed, many carriers, including FedEx, UPS, USPS, DHL e-commerce, and more implemented annual rate increases that took effect in January.
Based on the latest survey responses, the RLA expects costs to increase during the first quarter due to shipping rate increases taking effect in January. Volumes will likely remain on par as fourth quarter of 2021.
| |
Q4 2021 |
Q2 2022 |
| Costs |
67.2 |
76.7 |
| Volumes |
50 |
49.6 |
“Continued strong demand for goods combined with labor issues throughout the supply chain and outbreaks of the Omicron variant of COVID-19 will continue to weigh on returns costs for at least the first half of the year,” Tony Sciarrotta, managing director of the Reverse Logistics Association said. “Retailers and manufacturers will need to monitor their costs and work with supply chain partners to mitigate costs,” Sciarrotta said.
About the Returns Index
The RLA Returns Index is calculated based on responses from a quarterly survey completed by reverse logistics professionals. The survey questions ask about returns volumes and costs that they are currently experiencing, relative to the time of year, as well as how they expect volumes and costs to develop for the next quarter.
An index value of 50 indicates no change in the costs and volumes; above 50 indicates higher costs and volumes, while below 50 indicates lower costs and volumes.
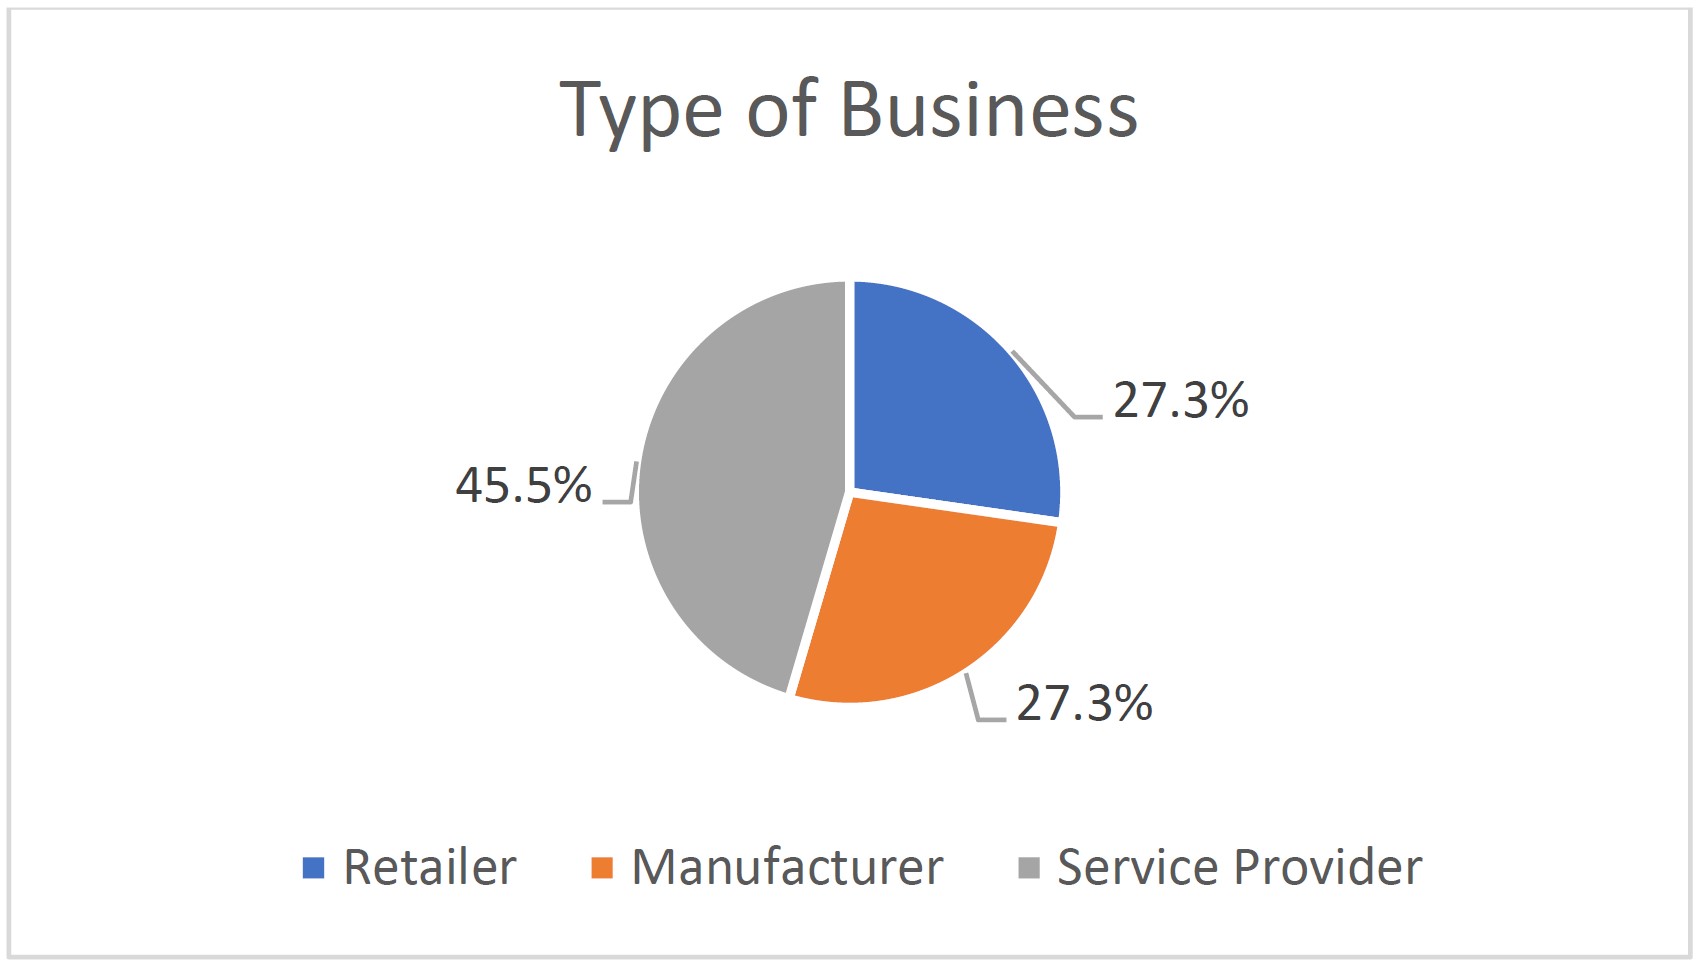
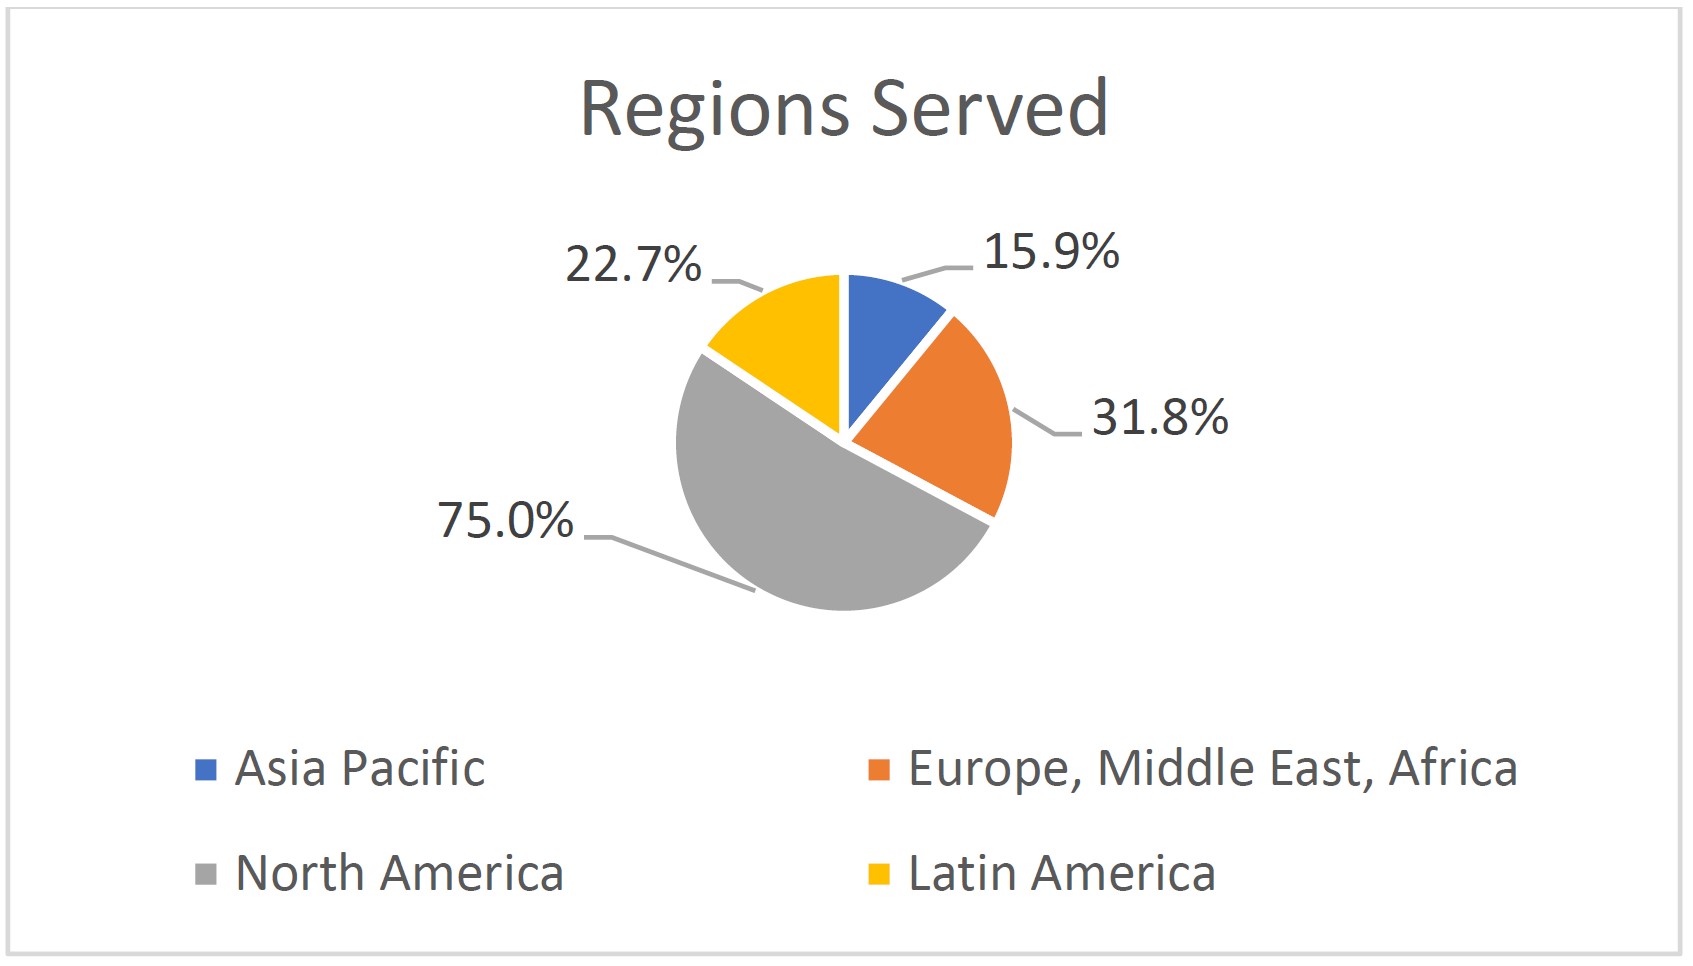
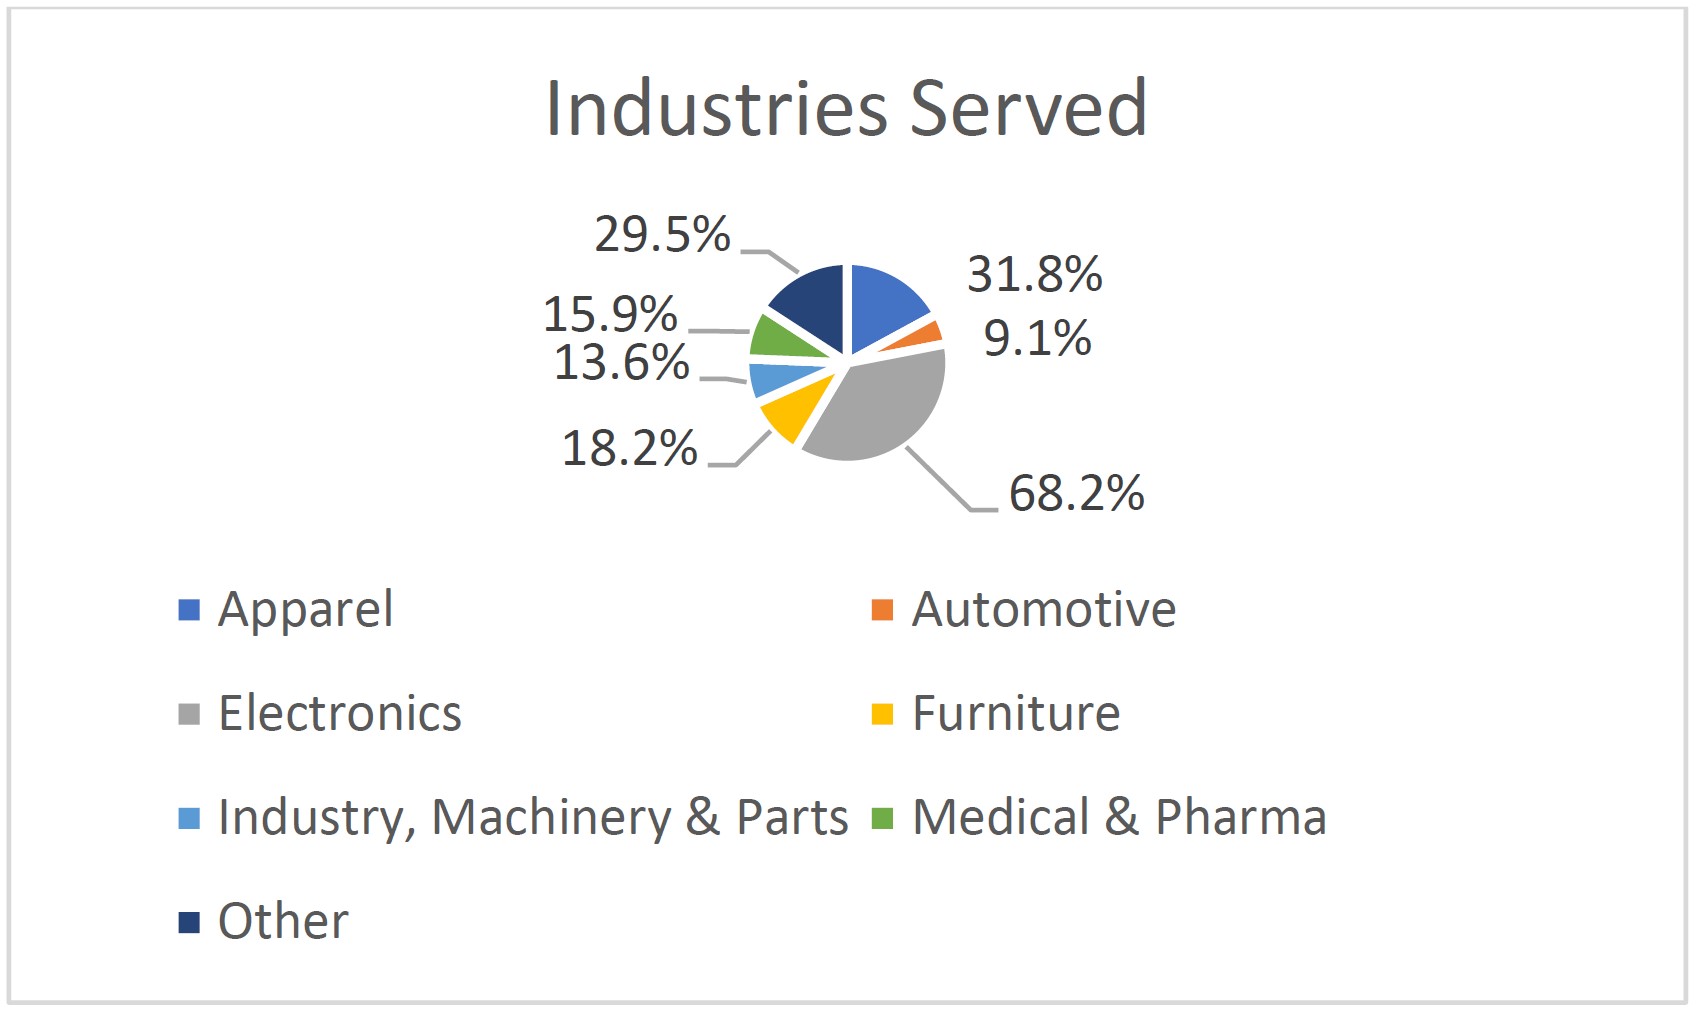
Survey Respondent Characteristics
For questions or more information, please contact:
Cathy Roberson
RLA Research Manager
cathy@rla.org
 Cathy Roberson
Cathy has over 20 years within the supply chain market including eleven years with UPS where she spent most of her time on competitive and market analysis for the Supply Chain Solutions subsidiary. After UPS, Cathy spent several years with various supply chain consulting firms focusing on market research before starting her own supply chain market research firm, Logistics Trends & Insights. Prior to UPS, Cathy worked at an e-commerce consulting start-up and at several libraries as a reference librarian. Cathy also writes for Air Cargo World magazine and other publications and is a frequent speaker at various supply chain conferences.